
Managing irrigation-drainage systems to sustainably enhance productivity in Fergana Valley, Central Asia
Background
Drainage water management, in the context of subsurface agricultural drainage, consists of managing outflow with a goal of reducing drainage volume and thereby increasing groundwater contribution to crop water demand due to rise of GWT (e.g., capillary upflow). However, the proportion of crop water use from upflow vary between soil types, decrease with increasing watertable depth and salinity, and increase where irrigation is withheld. Keeping aforementioned, controlled drainage may be an option with an existing drainage system that contributes a reduced drainage flow and lower irrigation requirements. At the farm level the introduction of controlled drainage has the potential to improve the livelihoods of farmers by reducing water application costs and maintaining agricultural production in water short years.
The project “Managing irrigation-drainage systems to sustainably enhance productivity in Fergana Valley, Central Asia” was carried out by SIC ICWC, working in collaboration with the ICARDA.
The research aimed to develop integrated irrigation and drainage management strategies incorporating controlled drainage, to save water, and protect soil and water resources in semi-arid regions. The main objective of the research is to monitor and execute controlled drainage experiments.
Goal:
The main objective of the CRP-5 is to monitor and execute controlled drainage experiments. The following tasks are considered in this research experiments:
- To know how the management of the GWL by controlled subsurface drainage will provide the opportunity to increase in situ crop water use, which should result in improved irrigation efficiency, higher water productivity and reduced drainage flow;
- To assess the impact of irrigation water supply and controlled GWL on soil moisture, soil salinity and drainage discharge;
- To assess total drainage flow and its water quality between controlled and conventional drainage sites.
- To monitor crop development and yield with establishment of phonological plots.
Expected outputs
- Stakeholder consultation to understand the challenges, the constraints, expertise of the national partners and studies that have been conducted in the past on the topic and the lessons learnt from them
- Demonstration trials and handbooks for farmers on suitable irrigation-drainage system for their agro ecosystems
- Farmer field days to showcase the difference between conventional and best practices in terms of yield increase and saving in input costs
- Consultation meetings to improve women role in managing surface and groundwater resources
Methods and Field experiments:
Design characteristics of the tile drainage system
The drainage site is located at the eastern part of the Central Fergana (southern part of Fergana depression) on the new developed lands.
Two closed horizontal drainages (CHD) made out of asbestos-cement tubes perforated from bottom with 11 openings
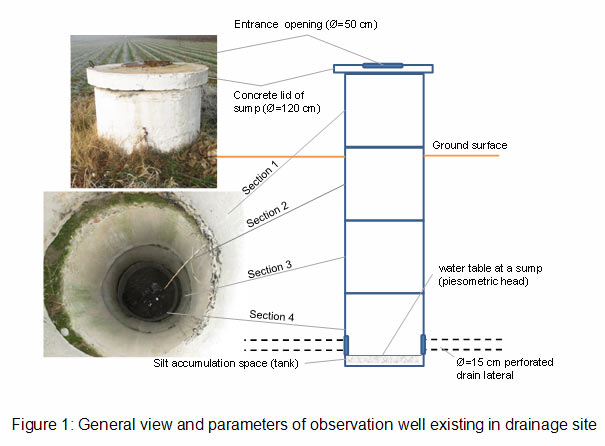
Two and three observation (monitoring) wells made from reinforced concrete with depth and diameter -100x100 cm are installed with four sections (Fig.1) at the CHD-1 and CHD-2, respectively. However, one out of two monitoring wells was operating in CHD-1 before start of the project. Hence, we have cleaned second well as well in order to create free water flow into collector.
Installation of gates to control the drainage outflows
Groundwater table control structure is a device used in conjunction with a tile drainage system to maintain a higher than normal water table. The principle objective of a water table control structure is to slow the drawdown of the water table to enhance crop production.
It was reviewed some of groundwater control construction techniques in Technical Report (2014), and among them polyvinyl chloride (PVC) risers on the drainage laterals to control drainage outlet used by Hornbuckle et al. (2005) seemed to be more practical and cost effective. The team of the project developed a similar PVC riser that further was entered into a drainage pipe outlet in the monitoring well (inspection sump) in order to grab free water flow.
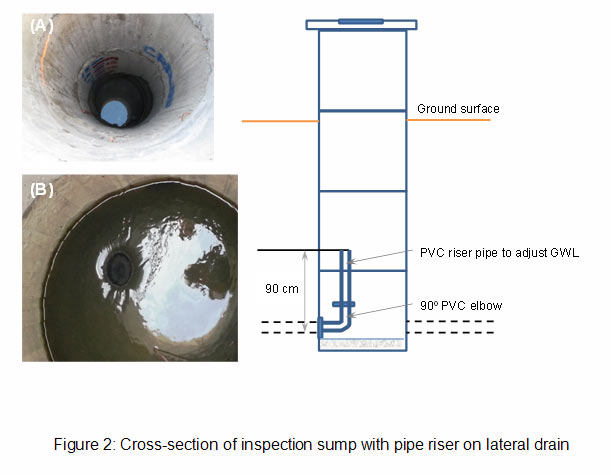
Sump sections are hermitically sealed with cement and further covered by bitumen in order to prevent raised water outflow from the sump. 3rd and 4th sections of inspection sump was marked with the red and blue color with 10 cm scale increments in order to easy eye monitor water level rise between drainage pipe bottom and riser opening (Fig.2A). Water level at the sump was raised freely up to 90 cm from the bottom of drainage pipe (Fig.2B), thereafter flowed through the open riser and drained out into the collector “Sredne-Kyzyl tepa”.
Installation of equipment’s and instruments
The following devices were installed at the experimental field:
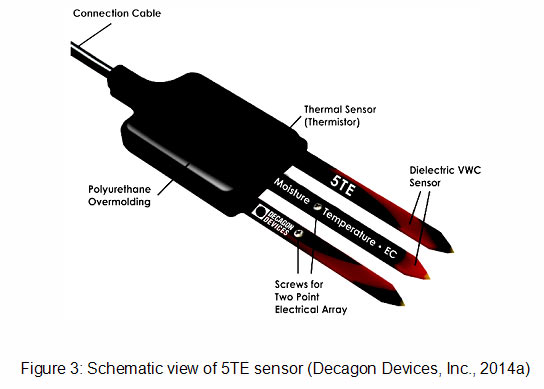
5TE sensor. The 5TE sensor (Decagon devices, Inc.) measures: (1) the apparent dielectric permittivity (ea) of soil to determine the water content (VWC, %) using an oscillator running at 70 MHz; (2) the soil temperature (T, oC) via thermistor in thermal contact with the sensor prongs; and (3) soil electrical conductivity (EC, dS/m) with the screws on the surface of the sensor form a two-sensor electrical array (Fig.3).
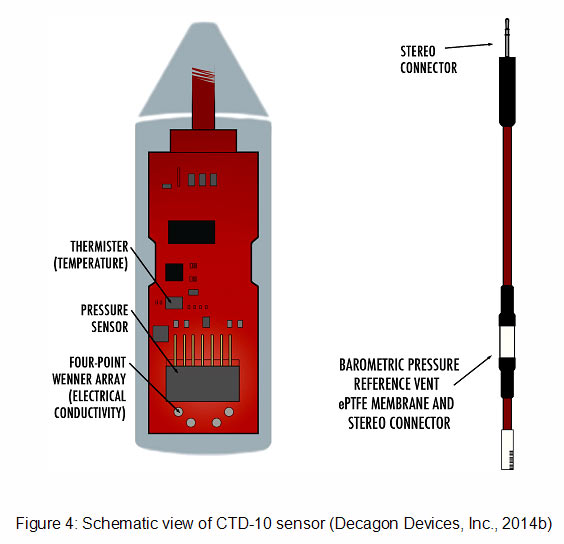
CTD-10 sensor. The CTD sensor (Decagon devices, Inc.) measures: (1) groundwater depth (GWT, m) using a vented differential pressure transducer to determine the pressure from the water column; (2) water temperature (T, oC) using a thermistor in thermal contact with the probe; and (3) electrical conductivity (EC) used by the screws on the surface of the sensor from a four electrode array (Fig.4).
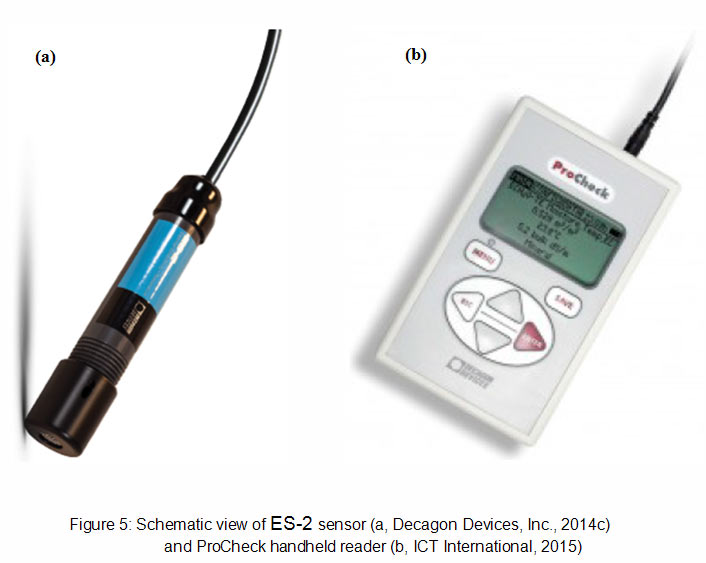
ES-2. The ES-2 sensor (Decagon devices, Inc.) measures: (1) water temperature using an onboard thermistor, and (2) water electrical conductivity using a stainless steel electrode array (Fig.5a). The Decagon ES-2 sensor (with 3.5 mm stereo connector) was designed to work most efficiently with ProCheck handheld reader (Fig.5b). The ES-2 sensor water EC reading is calibrated with laboratory chemical analysis for total dissolved salts (TDS) for the conversion purposes (e.g., dS m-1 into g l-1).
6 pieces of EM50G data loggers that have 5 slots each to insert sensors, we wired 21 pieces of 5TE sensors and 4 pieces of CTD-10 sensors into 5 EM50G data loggers and installed inside the fields. The devices were installed into the following places (e.g. near to phenological plots).
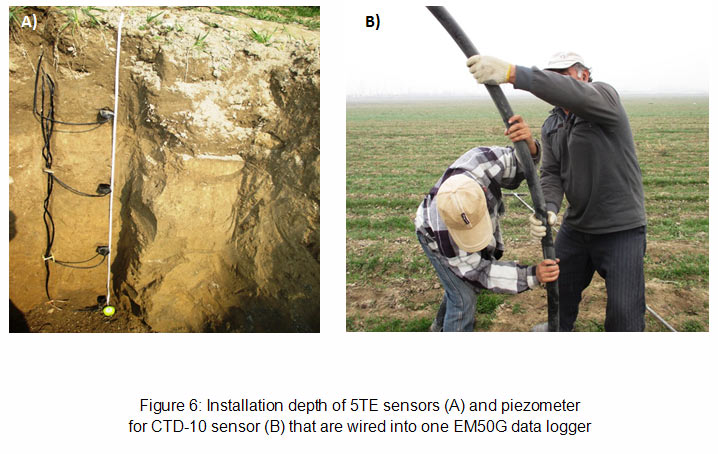
Phenological plots #1, 2, 3 and 6: four 5TE sensors with increments of depth 0-30, 30-60, 60-90 and 90-120 cm (Fig.6A) and one CTD-10 sensor into nearby installed piezometer (Fig.6B).
Phenological plot #5: Only five 5TE sensors with increments of depth 0-30, 30-60, 60-90, 90-120 and 120-150 cm.
Two CTD-10 sensors were wired into one EM50G data logger and installed at existing piezometers (3 m and 10 m) in SANIIRI branch in order to know the piezometric head between layers affected by water seepage from BFC and irrigation.
The state-of-the-art devices are installed twice in 2015, e.g., 1st installation date – March 3-4 and removed on June 14-15 (during winter wheat growing period) and 2nd re-installed on July 25-26 and again removed on October, before harvest of secondary crops. Data obtained from the devices are stored in CD and available upon request.