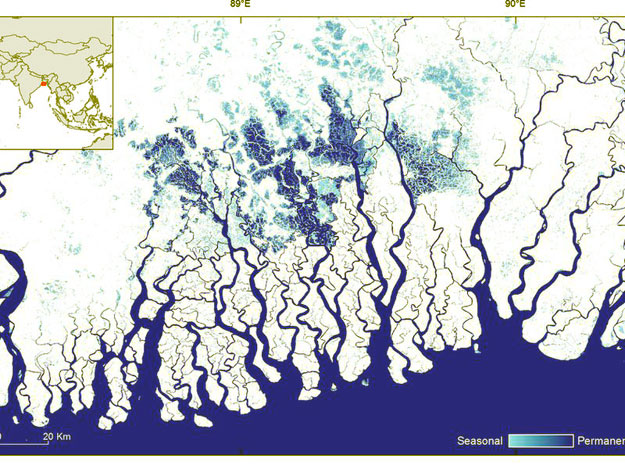
Surface water seasonality between October 2014 and October 2015 in the Sundarbans in Bangladesh. Dark blue indicates
Where and when surface water occurs on Earth is vitally important for all life. But that water is constantly in flux. Lakes, rivers and wetlands naturally ebb and flow; humans divert water for their own use and dam it up into reservoirs. Now researchers have mapped millions of high-resolution satellite images to document Earth’s surface water history going back three decades—revealing humanity’s dramatic influence as well as the natural variability of water patterns.
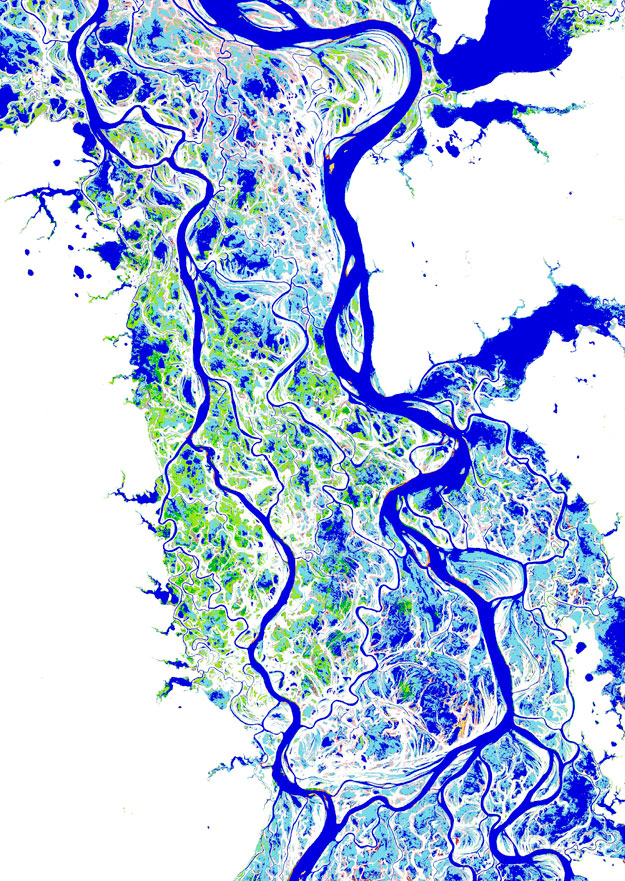
Agricultural engineer Jean-Francois Pekel and colleagues have created a kind of virtual time machine, showing past changes in surface water and providing a baseline for charting the changing future of our watery world. To achieve this feat, Pekel and colleagues used more than 3 million LANDSAT images of Earth’s lakes, wetlands, and rivers taken between 1984 and 2015. They quantified global water system changes over that timeline on a month-to-month basis. Then, they analyzed this veritable ocean of satellite data with the Google Earth Engine cloud-computing platform.
The result is as visually stunning as it is scientifically valuable. “[This] allows us to travel back in time and to make accurate measurements of our changing environment,” says Pekel, of the European Commission’s Joint Research Centre in Ispra, Italy. “Measuring the past contributes to our understanding of the long-term consequences of our past economic and societal choices, and contributes to more informed management decisions in the future.” He adds: “The old saying [is] ‘you can’t manage what you can’t measure.”
Map of the distribution and change in surface water over 32 years from over 3 million Landsat satellite images. This map shows the River Ob (Река Обь) in western Siberia, Russia and captures the spatial and temporal patterns in surface water. Dark blue colors are areas of permanent water and the lighter blue colors are areas of seasonal water. Green colors represent new areas of seasonal water and pink colors represent areas of lost seasonal water. (European Commission – Joint Research Centre, 2016)
The imagery reveals that, since 1984, permanent surface water has vanished from an almost 90,000 square kilometer area that spans mostly across the Middle East and Central Asia. Over 70 percent of all that water loss occurred in five contiguous countries: Iraq, Iran, Afghanistan, Uzbekistan and Kazakhstan. Drought is partly to blame, but so are human activities like unregulated river withdrawals and diversions, dams, and the subsequent shrinking of the southern Aral Sea, the authors find.
However, new permanent surface water has formed over more than double that area, and all of the continents except Oceania are showing areas of such growth, primarily due to reservoir filling. (Oceania shows a very small loss.) That’s surprising, because studies show that overall humans are draining freshwater faster than we thought.
One of the most striking conclusions to draw from the data is that change is localized. At a resolution of 30 meters, these detailed images allowed the team to see millions of lakes that are each less than 1 square kilometer in size, but together may represent as much as 40 percent of Earth’s total inland water area.
Some lands are water-rich: North America holds slightly more than half of Earth’s permanent surface water but is home to less than 5 percent of its people. Asia, where 60 percent of humans live, has only 9 percent of Earth’s permanent water—though its surface waters have grown by 23 percent during this period due largely to a boom in reservoir construction. Africa and Latin America each have about 9 percent of Earth’s permanent water, but Africa’s water is shared by twice as many people: 16 percent of the world total versus 8.6 percent.
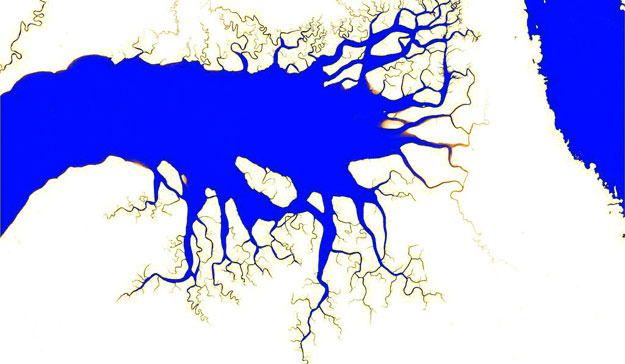
Map of the distribution and change in surface water over 32 years from over 3 million Landsat satellite images. This map shows an inlet in the south of the Bird’s Head Peninsula in West Papua, Indonesia and captures the spatial and temporal patterns in surface water. Dark blue colors are areas of permanent water and the pink colors show areas of where water occurs less often. (European Commission, Joint Research Centre, 2016)
Each region also contains its fair share of water winners and losers. “For example, if you consider the United States of America, the country’s permanent surface water is relatively stable—overall areas have increased by 0.5 percent since 1984,” Pekel says. “But during the same period, six western states (Arizona, California, Idaho, Nevada, Oregon, Utah) have lost 33 percent of their permanent water surfaces due to a combination of drought and sustained demands for water.” (Related: Taking a Closer Look at Global Water Shortages.)
Dai Yamazaki, a hydrodynamic engineer at the Japan Agency for Marine-Earth Science and Technology, calls the new imagery collection the best understanding yet of Earth’s changing surface water. Surface water “is in general most accessible water resource for human beings in many parts of the world, and also for many animals and plants easy-to-access water is essential for their lives,” notes Yamazaki, who wasn’t involved in the research. “Furthermore, existence or absence of surface water could be a indicator of flood and drought events [so] this observation-based analysis of global surface water dynamics is very important.”
The major surface water changes directly driven by human
engineering are typically more easily spotted from space than those due to climate variation. Pekel cites the recovery of Turkmenistan’s Garabogazköl Aylagy lagoon following the breach of a dam between the lagoon and the Caspian Sea in 1992. The Aral Sea crisis, caused largely by diversion of the rivers that fed the sea, is also obvious from space.
The impacts of shifting climate are more difficult to observe because they’re entangled with so many other factors, including changing human uses of water. But some can readily be seen, like the drought that impacted Australia from 2001 to 2009.
Watery changes on the roof of the world also stand out. “In some places, like the Tibetan plateau, where the direct human impact is limited, a cause and effect relationship with climate can be unambiguously established and is actually confirmed by other studies,” Pekel says.
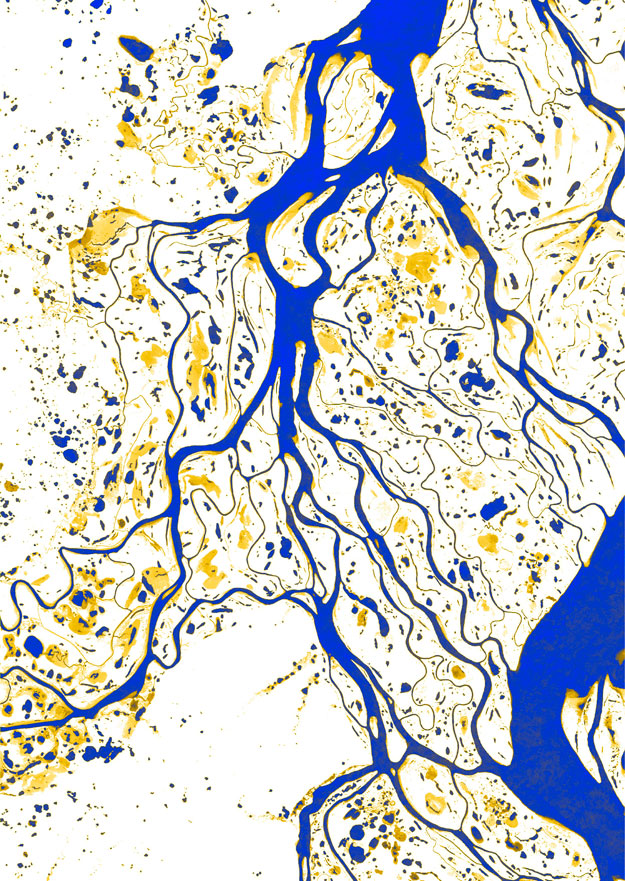
Map of the distribution and change in surface water over 32 years from over 3 million Landsat satellite images. This map shows the upper stretches of the Yenisei River (Река Енисей) in Russia and captures the spatial and temporal patterns in surface water. Dark blue colors are areas of permanent water and the pink colors show areas of where water occurs less often. (European Commission, Joint Research Centre, 2016)
Expansion of lakes on the Tibetan plateau, he notes, has been driven by accelerated snow-and-glacier melt caused by rising temperatures and increased precipitation. “What is impressive about the Tibetan plateau is both the speed and the extent of observed changes in lake expansion. It’s a pretty clear message that things are changing fast in the ’Third Pole,’” he adds.
“Climate change is a global-scale phenomena, but people’s interest must be how it affects their usual life,” Yamazaki adds. “This work is done at a global scale, but it has sufficient spatial-resolution to detect local change. This is I think why many people believe this work is great.”
Pekel and colleagues created maps that illustrate permanent versus seasonal water, gains versus losses, the consistency of seasonal water cycles, and more—all of it being made freely available at the Global Surface Water Explorer. Ultimately the revelations delivered by this spectacular imagery and the data sets that lay behind it comprise a valuable tool to inform future management and policy changes.
Source: http://www.smithsonianmag.com/
Dear User/Visitor! Please, answer on our questions: tick off one of the positions – your answer will make us able to improve our site and make it more interesting and useful!
