Urban water demand will increase by 80% by 2050, while climate change will alter the timing and distribution of water. Here we quantify the magnitude of these twin challenges to urban water security, combining a dataset of urban water sources of 482 of the world’s largest cities with estimates of future water demand, based on the Intergovernmental Panel on Climate Change (IPCC)’s Fifth Assessment scenarios, and predictions of future water availability, using the WaterGAP3 modelling framework.
We project an urban surface-water deficit of 1,386–6,764 million m³. More than 27% of cities studied, containing 233 million people, will have water demands that exceed surface-water availability. An additional 19% of cities, which are dependent on surface-water transfers, have a high potential for conflict between the urban and agricultural sectors, since both sectors cannot obtain their estimated future water demands. In 80% of these high-conflict watersheds, improvements in agricultural water-use efficiency could free up enough water for urban use. Investments in improving agricultural water use could thus serve as an important global change adaptation strategy.
Cities around the world are markedly expanding in size, as global urban growth (that is, increasing urban population) leads to more than two billion additional urban residents by 20301. Today, approximately 54% of the global population (that is, 3.9 billion people1) lives in cities, a fraction that is likely to grow to between 60% and 92% by the end of the twentyfirst century, according to the scenarios from shared socioeconomic pathways2 (SSPs). Domestic water use almost quadrupled over the last 60 years due to increasing population, wealth and access to drinking-water infrastructure3, and there was an even higher increase in water use in cities4.
This trend will continue, with domestic water use forecast under one scenario to increase by another 80% by 20305. A previous study6 has analysed a range of SSP scenarios and has estimated an increase of 50–250% in global domestic water withdrawals by 2050. This growth in demand comes just as cities are confronted with water-related problems caused by an increase in urban population, rising prosperity and changes in water supply, potentially leading to water shortage and groundwater over-abstraction7,8. Climate change poses an additional risk to metropolitan areas and will probably exacerbate rather than ameliorate the major water challenges in the future9,10,11. Climate change is expected to alter renewable freshwater resources in many regions of the world, causing change in spatiotemporal temperature and precipitation patterns and largely increasing evaporative demand12.
Global hydrological models (GHMs) are useful tools to simulate changes in the water cycle and to quantify the impacts of change in both water supply and demand for renewable freshwater availability and sectoral water use. Recent studies estimated that 3.5–4.4 billion people are expected to live under water scarcity in 2050, because of climate change and increasing water demand for human activities13,14. Similarly, water shortage has been identified as a major threat to urban water supply8,15. More than one billion urban residents may face water shortage in the future owing to urbanization and climate change11. A previous study16 has estimated the vulnerability of 70 large cities (of more than 750,000 inhabitants per city) to changes in future water demand under normal climate conditions, and found that some of these cities may face chronic water scarcity in the future.
However, previous global studies did not fully account for urban water infrastructure that transfers water across watershed boundaries. Accounting for these transfers in models is crucial to avoid a substantial overestimation of urban water stress7. Moreover, previous studies did not use an integrated approach when examining changes in climate as well as the broad spectrum of socio-economic changes envisioned in the SSP. Major socio-economic changes include urbanization, which leads to an increase in municipal water demand, as well as agriculture-sector changes, which will markedly increase water withdrawals in some areas.
The aim of our study is to assess urban water provision under climate change impacts and socio-economic changes in the future (2050s). We provide estimates of the urban surface-water deficit (that is, the supply gap) highlighting the competition between urban water provision, agricultural water demand and environmental flow requirements. Finally, implications for groundwater resource uses are addressed.
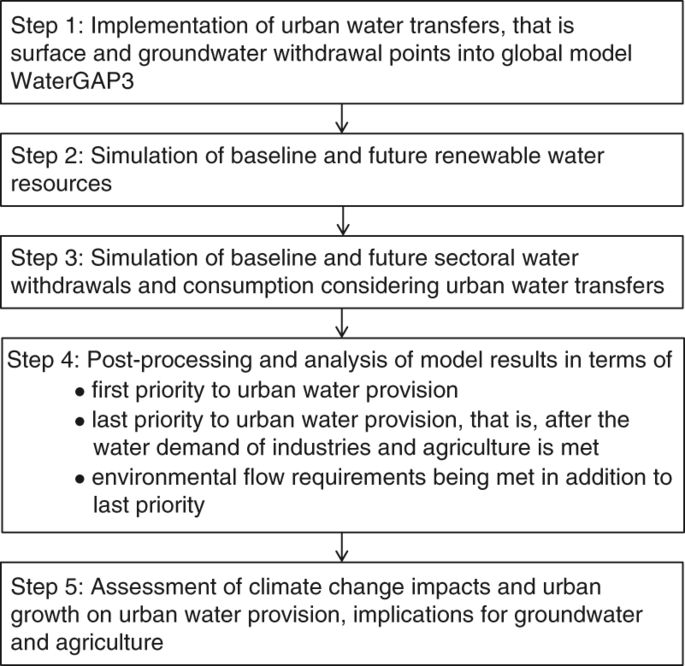
Our study focused on 482 cities containing 736 million people today. Climate change uncertainty has been addressed by using output from an ensemble of five general circulation models (GCMs) associated with RCP6.0 and socio-economic assumptions following a business-as-usual scenario (SSP2). The radiative concentration pathways (RCPs) are not associated with unique socio-economic scenarios17 and the selection of RCP6.0 and SSP2 is a suitable combination of the scenario matrix architecture18,19. We quantified the urban surface-water deficit as well as additional withdrawals from groundwater resources (urban groundwater footprint) in the future by testing two scenarios: that urban dwellers have the highest priority to be supplied with water (first priority), or that urban dwellers have the lowest priority after other water users, such as industry and agriculture (last priority)20. Furthermore, we considered the consequences of implementing environmental flow requirements as an additional constraint on water allocation. Then we identified which cities will be most affected in the future, determined the number of people and irrigated area not supplied, and assessed the possibility of water saving to reduce or prevent the impacts (Fig. 1). Because urban water transfers put pressure on water resources that are sometimes far away from the city’s location, we integrated detailed information on infrastructure and water management7 (that is, withdrawal points of cities) into the WaterGAP3 modelling framework, which comprises a global hydrology model21 and global water use models3,22 (see Methods and Supplementary Tables 1, 2).
Urban surface-water deficit and implications
If cities have first priority over other sectors, 16.1% of cities in our sample with surface-water withdrawal points experienced at least one month with a surface-water deficit within the baseline period 1971–2000 (hereafter referred to as the baseline). A surface-water deficit means that the available amount of surface water is less than the demand, and that cities must therefore depend on water storage to make it through such periods. By contrast, 38.9% of cities would be vulnerable to an urban surface-water deficit if cities have the last priority. Integrating environmental flow requirements (see Methods) into our analysis23,24 leads to a decrease in surface-water resources available for urban use and therefore to an increased number of cities vulnerable to water scarcity (first priority scenario, 36.3%; last priority scenario, 62.5%; see Supplementary Information and Supplementary Tables 3, 4).
Considering the effects of global warming and urbanization, the number of cities affected by surface-water deficit is likely to increase to 27.6% in 2050 (Fig. 2a). Almost 46.6% of cities may experience a surface-water deficit if environmental flow requirements also need to be fulfilled. In 41% of all river basins, the needs of agricultural water users will conflict with those of cities, as there is not enough water to supply both urban and agricultural needs. South Asia is a hotspot region where competition between urban and agricultural demand is generally highest. The United States shows a clear division between cities in the West that are vulnerable to a surface-water deficit and cities in the East that have little vulnerability.
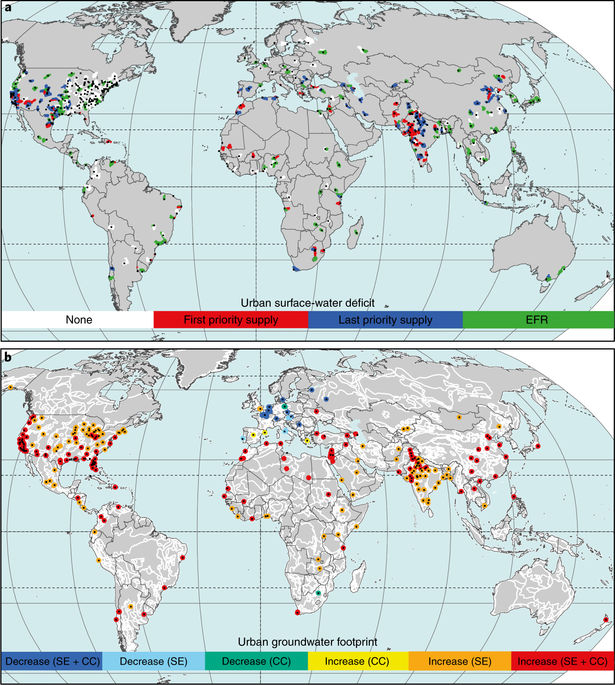
a, Urban surface-water deficit (n = 416). Subbasins are highlighted where monthly urban surface-water deficits occur in a 30-year period in the future (2041–2070). We distinguished subbasins with a urban surface-water deficit even when cities get the first priority for water (red), those basins where competing use of water by industry and agriculture would create a water deficit (last priority supply of urban water; blue), and basins in deficit after additionally accounting for environmental flow requirements (EFR, green). b, Urban groundwater footprint (n = 251). We show the trend in urban groundwater footprint in regional aquifers between the baseline (1971–2000) and the 2050s (2041–2070) and the main drivers of change. Groundwater withdrawal points will have more water vulnerability if marked in yellow (CC, climate change), orange (SE, socio-economic changes) and red (SE + CC, socio-economic and climate changes). Groundwater withdrawal points will have less water vulnerability if marked in green (climate change), light blue (socio-economic changes) and blue (socio-economic and climate changes). Black dots represent cities.
If a provision is made for environmental flows, many more river basins and the cities that source from them will experience water deficits. Globally, in our urban first priority scenario, about 14,000 km2 of irrigated area (in its extent of the year 2005) are at risk of crop water deficit in 2050 as a result of an increase in the urban water supply, a reduction in freshwater availability and simultaneous increase in agricultural demand. Similarly, setting additional water aside for environmental flow would further increase the irrigated area at risk of having a water deficit to 180,000 km2, which is about 6% of the current global area that is equipped for irrigation (see Methods, Supplementary Information and Supplementary Table 5).
Unsustainable urban groundwater provision
Increasing demand for urban water supply will also put additional pressure on groundwater resources. The quantification of a groundwater deficit (in units of volume, such as litres) was not possible owing to lack of complete global datasets of aquifer-specific storage. Storage is particularly important for groundwater, because the volume of water stored in aquifers sometimes greatly exceeds the flows of water into and out of the aquifer. Instead, we investigated urban groundwater stress by calculating the urban groundwater footprint (UGF)7,25 of regional aquifers26 providing cities with groundwater for the baseline period and the 2050s. The UGF is a unit-less ratio of groundwater use to estimate recharge, and is used to identify cities that are using groundwater in a way that will reduce aquifer storage.
Climate change and socio-economic developments, including urbanization, lead to an increasing urban groundwater footprint (Fig. 2b). As a result, the UGF increases in 238 cities with groundwater abstraction points (95%) and will more than double in 116 cities in 2050. Twelve cities might be regarded as groundwater-stressed (defined as UGF ≥1) where annual urban groundwater abstractions alone exceed groundwater recharge of regional aquifers. Although aquifer storages might be available to serve these cities in the future, a drop in groundwater levels may result in higher costs for abstraction. Furthermore, urban water supply of 61 cities depends solely on groundwater abstractions with 59 cities experiencing an increasing trend in UGF.
Future threats to urban water provision
Figure 3 presents the urban surface-water deficit under first priority and last priority assumptions as well as considering environmental flow requirements. The global urban surface-water deficit is about 1,386 million m³ in 2050 if urban water supply has first priority. This number corresponds to 3% of the baseline urban surface-water demand. Under last priority assumptions, 161 cities are likely to be vulnerable to urban water deficits, with a total surface-water deficit of 6,764 million m3(that is, 15% of baseline demand). Under the last priority scenario, and with environmental flow requirements considered, the surface-water deficit will be significantly higher and increase up to 28,842 million m³ (that is, 62% of baseline demand) (Supplementary Table 6).
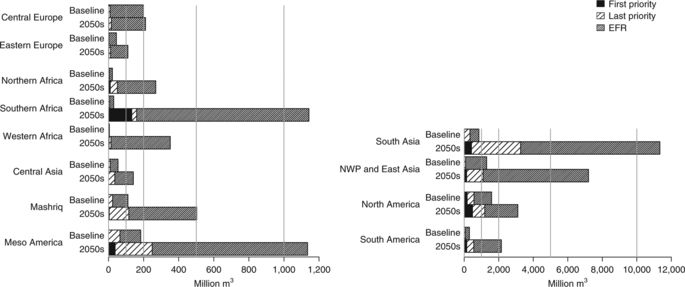
If cities get priority (first priority), the urban water deficit is the lowest. If cities come after other sectors (last priority), the urban surface-water deficit is higher. Finally, if in addition water is set aside for EFR, the urban surface-water deficit is highest. Median annual urban surface-water deficit is shown for the baseline (1971–2000) and 2050s (2041–2070) based on results taking into account climate forcing data of five GHMs (see also Supplementary Table 6). NWP, Northwest Pacific.
Regional differences in urban surface-water deficit are apparent for baseline conditions but are more pronounced in the future. For the baseline time period, the urban surface-water deficit is relatively minor in most UNEP GEO subregions, except North America. In 2050, the urban surface-water deficit is likely to exceed 400 million m³ in both South Asia and North America, even if urban water supply has first priority. Note that in these water deficit areas in the first priority assumption, any other water demand by another sector will therefore also by definition not be fulfilled. Other regions, such as southern Africa, South America as well as northwest Pacific and East Asia will become vulnerable to urban water supply due to rapid urbanization. Under the last priority scenario, the urban surface-water deficit is much larger, although with a corresponding decrease in water scarcity for other sectors. The marked difference between the first priority and last priority scenarios shows that integrated multi-sectoral management solutions will be required in many areas to adapt to water scarcity.
Under the assumptions of a business-as-usual scenario (SSP2) more than 440.5 million people will live in cities with a water deficit in the future even in the first priority scenario, 36.4% of the population of the cities that we studied. In the last priority scenario, 673.3 million urbanites will live in cities with a water deficit (55.6%). However, many more people live in the basins from which cities are withdrawing water, and are therefore likely to be affected by urban surface-water deficits. We estimated that 38.3 to 480.4 million others living in source watersheds will be affected by the cities’ transfer of water, showing that urban surface-water withdrawals decrease water security for others who live sometimes far from the city centre. Therefore, the total number of people (in our studied cities, plus in their source watersheds) affected by the urban surface-water deficit is much higher (up to 1,464.7 million if environmental requirements are considered) (Table 1).
Solutions to reduce the urban surface-water deficit
Altogether 40% of cities (409 million people) are vulnerable to urban surface-water deficits under the last priority scenario, because of competition with water abstractions for irrigation. Urban water demand could be met in these basins by improving water-use efficiency of the agricultural sector as a soft-path measure to reduce irrigation water withdrawals14. Efficiency improvements can result from switching from less-efficient flood irrigation to more-efficient sprinkler or drip irrigation, reducing leakages in water infrastructure to the fields, changes in plant varieties, and simply better information about when and where to irrigate27. Assuming a moderate increase of 10% in irrigation water-use efficiency, which is about 0.3% per year over a 50-year time period, could reduce the urban surface-water deficit by about 2,618 million m³ and therefore help 78% of the vulnerable cities and their 236 million urbanites to overcome water deficits in the future (Fig. 4).
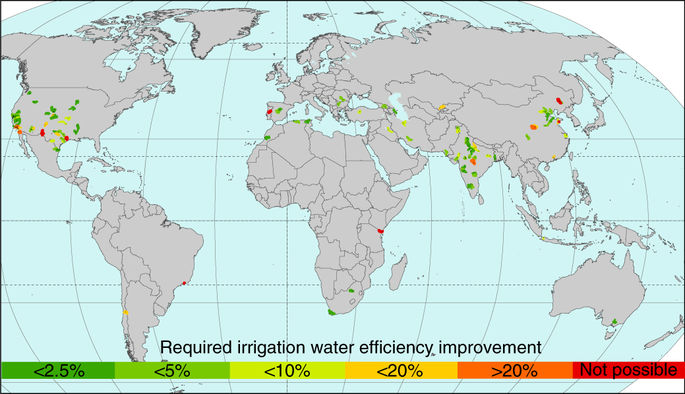
The red colour indicates subbasins where the urban surface-water deficit exceeds the consumptive use of irrigation water and therefore, an efficiency improvement is not adequate to fully resolve the water deficit.
An efficiency improvement of 10% in agricultural crop irrigation will help to overcome the urban surface-water deficit in at least 93 subbasins without additional measures, whereas a further improvement up to 30% would be required in 14 subbasins. In 7 subbasins the improvement in irrigation efficiency will not be an adequate measure for reduction, because the urban surface-water deficit already exceeds the amount of water consumed by plants. Here, other measures should be considered, such as a reduction in irrigated land, wastewater reuse or improving agricultural water productivity14,28, but these measures are not addressed in this study. Nonetheless, it is necessary to note that there is room for efficiency improvements in the future that depends not only on current irrigation technologies but also on future investments, expected economic gains and the willingness to adopt practices.
In 2050, cities, such as Los Angeles, Jaipur and Dar es Salaam, are forecast to have the greatest surface-water deficits that will exceed, on average, 100 million m3 per year (Fig. 5). Adapting to these annual deficits corresponds to savings of between 30 and 150 litres per capita per day. The urban surface-water deficit of the top 20 cities is about 2,338 million m3 (35% of the total deficit).
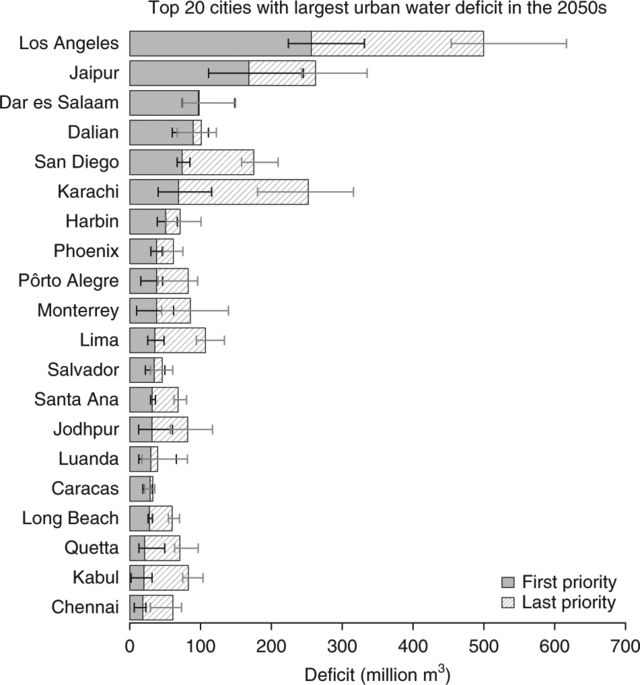
Two scenarios were analysed: (1) urban surface-water supply gets first priority; or (2) cities receive the remaining water after water demand of other sectors has been fulfilled (last priority). Median urban surface-water deficit is shown; error bars represent the range of uncertainty resulting from the climate forcing data of the five GHMs. Only withdrawal points located in subbasins ≥10 grid cells (>800 km2) are considered.
Urban water transfers export water insecurity
Our implementation of inter-basin transfers into a global water modelling framework is a step forward toward quantifying urban water security. Our results suggest that cities are already vulnerable to water shortages today4,29 and one in six large cities is likely to be at risk of water deficits. Urban population growth will make solving this problem harder, as another 595 million people will be in the cities that were included in this study in 2050. This rapid growth will likely require large-scale maintenance, improvement and extension of the existing infrastructure.
Our findings help to quantify a statement from ref. 30 that indicates that interactions between cities and the countryside will become increasingly intertwined. Because of inter-basin transfers, many cities shift their water deficits to river basins far outside of the cities and remotely impact millions of people, economy and aquatic ecosystems. For every three urban residents living in a city that avoids water deficit via cross-basin transfer, there is one person affected remotely in the source basins (last priority assumption). Our results show that climate change and increased urban demand will lead to markedly greater competition between the agricultural and urban sectors for water, affecting a large fraction of the world’s river basins.
Adapting urban water supply to climate change impacts and increasing urbanization is a major challenge cities will have to face in the future. Technical and governance solutions to reduce or even prevent future urban surface-water deficits cannot be discussed in isolation31, but have to be integrated not only into water requirements of other sectors in the basins and aquifers where the water is abstracted but also in upstream areas. This is particularly important in case of cities that are likely to be at risk of deficits even under the first priority assumption. For cities that will have a deficit only under the last priority assumption, one possible solution is an increase in irrigation water-use efficiency to relieve conflict between urban and agricultural water demands. We found that an increase in irrigation water-use efficiency of 10% can serve as an adaptation option to overcome urban surface-water deficits for 236 million people.
Source: https://www.nature.com/
Dear User/Visitor! Please, answer on our questions: tick off one of the positions – your answer will make us able to improve our site and make it more interesting and useful!
